After a well is drilled and developed, it is usually pumped at a controlled rate while the water level is measured, and the results are written up as a test pumping report. Owners tend to file it away. That is a pity, because it is the document every later decision about the well depends on: which pump to buy, how deep to set it, how much storage to build and how hard the well can be worked. This guide is about reading that document. Why test pumping is done in the first place is covered separately.
Formats vary; the fields are similar
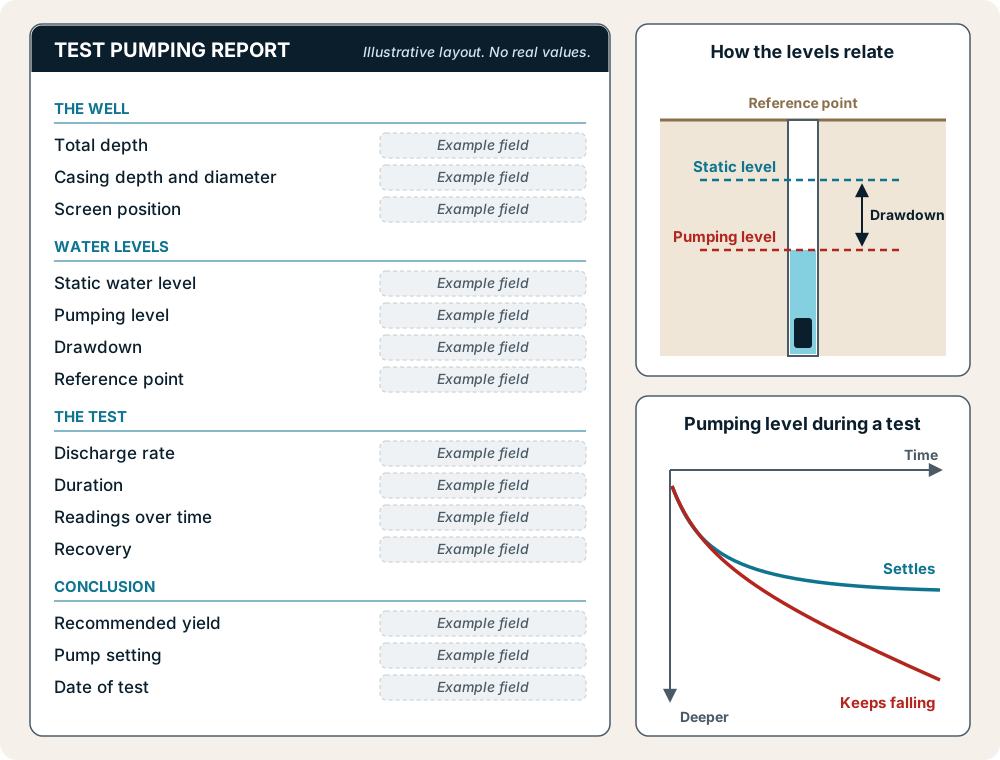
There is no single standard layout. Some reports are a typed summary, some a handwritten log, some a table of readings with a short conclusion. What matters is that the key fields are present. The diagram below shows them in a simplified form, with no real values, so you know where to look on whatever format you are given.
The well itself: depth and construction
The report usually starts with the well: its total depth, the casing depth and diameter, and where the screen sits if there is one. These fields matter later because they set the physical limits on where the pump can go. A pump must stay clear of the bottom and normally above the screen, so the construction details define the space the pump has to work in.
The water levels
Three levels form the heart of the report. The static water level is where the water stood before pumping began. The pumping, or dynamic, level is where it settled while the pump ran. Drawdown is the difference between the two. Each level is usually given as a depth below a reference point, often the top of the casing or ground level; check which, because the difference matters when the numbers are used to set a pump.
Rate, duration and the shape of the curve
The discharge rate is how much water was pumped during the test, and the duration is how long it ran. These two fields give the drawdown its meaning: a drawdown figure is only useful alongside the rate that produced it and the time it took. Where the report includes a table of readings over time, the shape matters more than any single number. A level that falls and then holds steady suggests the well settled at that rate. A level that keeps falling right to the end of the test suggests the rate may be more than the well can sustain over longer periods, or that the test was not long enough to show where it would settle.
Some tests are run at more than one rate, in steps. Where they are, the relationship between rate and drawdown at each step shows how the well responds as it is pushed harder.
Notice also how the rate was measured. A report that states the method, such as a flow meter or timing the fill of a container of known volume, is easier to trust than one that gives a flow figure with no explanation.
Recovery, and what is often missing
Recovery describes how the water level rose back after the pump stopped. It shows how quickly the well refills, which matters for a villa whose demand comes in bursts. It is also the field most often left out. A report that records drawdown but no recovery tells only half the story.
- Is recovery recorded, or does the report stop when the pump stopped?
- Is the date of the test shown, so you know which season it reflects?
- Is the reference point for the levels stated?
- Was the test long enough for the pumping level to settle?
- Is a recommended operating yield given, and is it consistent with the readings?
The date is easy to overlook and quietly important. A test run at the end of the wet season describes the well at its most generous, and the levels in the dry months may be lower.
Older wells and missing records
Many wells on the islands were drilled years ago, and the report, if there ever was one, has been lost or was never more than a line on an invoice. A well that has been in use for years may also not behave as it did when new: screens can clog and pumps get changed. Where the record is missing or old, a fresh test gives a current baseline, and comparing it with any earlier figures shows whether the well's performance has changed.
From report to decisions
Many reports end with a recommended operating yield, and sometimes a recommended pump setting. These are the driller's or hydrogeologist's interpretation of the data, made with knowledge of the site, and they carry more weight than any single figure an owner might pick out. The report is best read as one input into a set of decisions rather than a verdict on its own: the pump is chosen to deliver the required flow at the operating yield, set at a depth based on the pumping level and construction, and supported by storage sized to bridge the gap between what the well gives and what the property demands at its peaks.
Deep Well Samui carries out test pumping across Samui, Phangan and Koh Tao and explains the results in plain terms, including re-testing older wells whose records are incomplete. If you have a report and are not sure what it is telling you, we can walk through it with you.